The NBA may be a star-driven league, but its financial structure ensures that building a roster requires more than identifying talent. It’s not just about finding the right player; it’s about finding the right player at the right price.
With team values continuing to climb, owners can afford to pay an underachieving player. The real pain is in the opportunity cost: What could you have gotten for that money instead? How else could you have beefed up your roster?
It’s no surprise, then, that teams continue to search for new inefficiencies and measures of value, in a statistical revolution.
As with any bet, though, occasionally you gamble and lose.
Here are some of this season’s big losses.
How We Determined Who’s ‘Overpaid’
The inventor of the methodology we’re using here is David Berri, a sports economist at Southern Utah University and a former Forbescontributor. The number-crunching involves a few thorny decisions, but the premise is beautifully straightforward.
Figure out what a player should be making. Compare that against what he is actually making. The difference between the numbers is the amount by which he’s overpaid (or underpaid). Rinse and repeat.
Berri’s big contribution is the method he devised to produce the first estimate—what a player should be making. We start with the fact that, under the league’s collective bargaining agreement, players as a group are guaranteed roughly 50% of basketball-related income. Because we don’t yet know the BRI figure for the 2018-19 season, we’ll use last season’s: BRI was $7.147 billion, and the players’ share was $3.645 billion, according to Larry Coon’s NBA Salary Cap FAQ.
If we assume that teams are paying players to win, we can divide the players’ income by the total number of regular-season games (1,230) to produce an estimate of the value of a win: $2.963 million. (Yes, for the purposes of this analysis, we’re ignoring the fact that teams sometimes may not want to win or may be paying players for a reason other than winning, like boosting ticket sales. We’re also ignoring playoff games in computing the value of a win because players are paid out of their salaries solely during the regular season.)
From there, if we multiply our win value by the number of wins a player produces, we arrive at that player’s value for the season—his “expected” salary.
We have many win estimates to choose from in this player analysis, but all of them have the same basic goal: boil down a number of statistics (like points, rebounds and turnovers) into one number to measure how many wins a player contributed to his team. All of these metrics have their strengths and weaknesses, so in this analysis, we will be taking the average of three win estimates to try to minimize the blindspots of any one of them. Our three inputs: Wins Produced, a metric created by Berri and listed at BoxScoreGeeks.com; a wins estimate based on the metric Value Over Replacement Player, which is calculated by Basketball-Reference.com and is itself based on the metric Box Plus/Minus; and Win Shares, another metric calculated by Basketball-Reference.
Of course, these metrics are limited by the inputs they’re using; if the metric doesn’t account for something that’s inherently hard to quantify—for instance, a player’s ability to man up on defense—then that metric won’t fully capture a player’s value. But while it’s easy to point out that problem, it’s not so easy to solve it. We’re left with an imperfect measure.
Because these metrics are assessing a player’s contributions relative to a theoretical replacement-level player, they can be negative—that would suggest the player is actually worse than a replacement the team could pluck out of, say, the G League. In our analysis, though, a negative win estimate would make the player’s expected salary a negative number, suggesting the player was actually paying the team to play. While many fans might take that deal, we’ve substituted in zeroes whenever a metric turns negative so the lowest an expected salary can go is $0.
For player salaries, we are using data from Spotrac. Importantly, we are using the player’s cap figure—which is what the team is actually paying him—rather than his base salary. In the vast majority of cases, those numbers are the same, but when they differ, the cap figure will provide a more accurate measure of value.
Who We Considered For The ‘Honor’
We could perform this analysis on all 530 players who appeared in an NBA game this season, but because players accumulate wins across games, our overpaid list would be dominated by players who barely saw the court, many of them because of injury. To avoid that, we added in minimum thresholds of 41 games and 500 minutes played. Those are fairly arbitrary numbers, but they do measure a large enough portion of the season that a player’s real value should start to come through.
We also excluded players whose contracts are governed by the rookie salary scale. That left us with 257 players to analyze.
We compiled the data. We crunched the numbers. These are the 10 players who appeared to be the most overpaid.

10. Chris Paul
Point guard, Houston Rockets
- Wins Estimate Average: 7.4 (6.5 VORP wins, 6.6 Win Shares, 9.1 Wins Produced)
- Expected Salary: $21,906,447
- Cap Figure: $35,654,150
- Difference: $13,747,703
Paul is having a reasonably productive season—with 9.1 Wins Produced, he is tied for 45th in the league despite playing only 58 games—but his Win Shares and VORP wins figures are easily career lows and are noticeably down from the 10.2 and 11.6 he posted last year, when he also played 58 games. If he could stay healthy, this contract wouldn’t look so bad—he still has two years to go, plus a player option for 2021-22 at $44,211,146—but he’s missed 69 games across the last three seasons. Can the Rockets really count on having him for a full season?

9. Wesley Matthews
Shooting guard, Indiana Pacers
- Wins Estimate Average: 1.6 (0.8, 2.7, 1.4)
- Expected Salary: $4,849,443
- Cap Figure: $19,135,259
- Difference: $14,285,816
Matthews’ current contract might not look so bad—he counts $512,746 against the Pacers’ cap—but that’s only because he was waived by the Knicks in February. For this analysis, we combined his two cap figures, as well as his on-court production across his three stops this season.

8. Kent Bazemore
Shooting guard, Atlanta Hawks
- Wins Estimate Average: 0.5 (0, 0.7, 0.9)
- Expected Salary: $1,580,267
- Cap Figure: $18,089,887
- Difference: $16,509,620
Bazemore hasn’t come close to living up to a deal he signed in 2016—the year the salary cap spiked and the value of contracts surged. Bazemore still has a player option for next season; count on him taking the $19,269,662.

7. Tim Hardaway Jr.
Shooting guard, Dallas Mavericks
- Wins Estimate Average: 0.7 (0, 1.8, 0.3)
- Expected Salary: $2,074,100
- Cap Figure: $19,200,127
- Difference: $17,126,027
The Mavericks took on Hardaway’s pricey contract as a cost of acquiring Kristaps Porzingis. On top of his $17,325,000 base salary, he earned $1,875,127 when the Knicks dealt him as a result of a trade kicker.
Hardaway averaged a career-high 18.1 points this season, but he didn’t get there particularly efficiently, shooting .393 from the field and .340 from 3. With another year on the deal and a player option for 2020-21, he won’t be coming off Dallas’ books as soon as the team might like.

6. Allen Crabbe
Shooting guard, Brooklyn Nets
- Wins Estimate Average: 0.3 (0, 0.8, 0.1)
- Expected Salary: $888,900
- Cap Figure: $18,500,000
- Difference: $17,611,100
Crabbe’s contract is another from the fateful summer of 2016. He appeared in just 43 games this season because of injuries and had middling numbers when he did play, shooting an abominable .342 on 2-pointers. Coming off arthroscopic knee surgery, he seems likely to pick up his $18,500,000 option for next season.

5. Otto Porter Jr.
Small forward, Chicago Bulls
- Wins Estimate Average: 2.8 (2.7, 3.2, 2.5)
- Expected Salary: $8,296,400
- Cap Figure: $26,011,913
- Difference: $17,715,513
Porter, whom the Bulls acquired from the Wizards in February, is a good player, shooting .429 on 4.3 3-point attempts a game over the last three seasons. But he is more of a complementary piece, not the No. 1 option his contract would suggest. With a player option for 2020-21, the Bulls may be paying him $55,739,813 over the next two years. (Then again, who else are they going to spend their money on?)

4. Gordon Hayward
Small forward, Boston Celtics
- Wins Estimate Average: 4.4 (3.2, 4.9, 5.1)
- Expected Salary: $13,076,707
- Cap Figure: $31,214,295
- Difference: $18,137,588
Hayward is still scraping off the rust after returning this season from the leg injury he suffered in the 2017 season opener. If he can get back to the form he showed with the Jazz in 2016-17, this contract won’t be a problem. That season, he was worth 10.8 VORP wins, 10.4 Win Shares and 12.5 Wins Produced, for an average of 11.2. That translates to an expected salary of more than $33 million (using this season’s win value figure).

3. Jabari Parker
Power forward, Washington Wizards
- Wins Estimate Average: 0.5 (0, 1.4, 0.2)
- Expected Salary: $1,580,267
- Cap Figure: $20,000,000
- Difference: $18,419,733
Parker ended up on the Wizards in the big-money swap for Otto Porter Jr. Parker, though, performed little better than a replacement-level player this season. In a particularly bad sign, his Defensive Win Shares figure exceeded his Offensive Win Shares figure with both of his 2018-19 teams—and this is not a player known for lock-down defense. The Wizards hold a club option for next season that they will almost certainly decline.

2. Harrison Barnes
Small forward, Sacramento Kings
- Wins Estimate Average: 1.2 (0, 3.6, 0)
- Expected Salary: $3,555,600
- Cap Figure: $24,793,702
- Difference: $21,238,102
Barnes is the fifth player on this list to have changed teams this season, joining the Kings from the Mavericks in a February trade that earned him a $686,444 kicker. His shooting percentages perked up after the move, and his Win Shares Per 48 Minutes figure rose to .084, from .059. But that won’t be enough to justify the $25,102,513 salary Sacramento will have to pay him next season if he exercises his player option. He would probably offer more value at power forward, but the Kings have a big-man logjam.

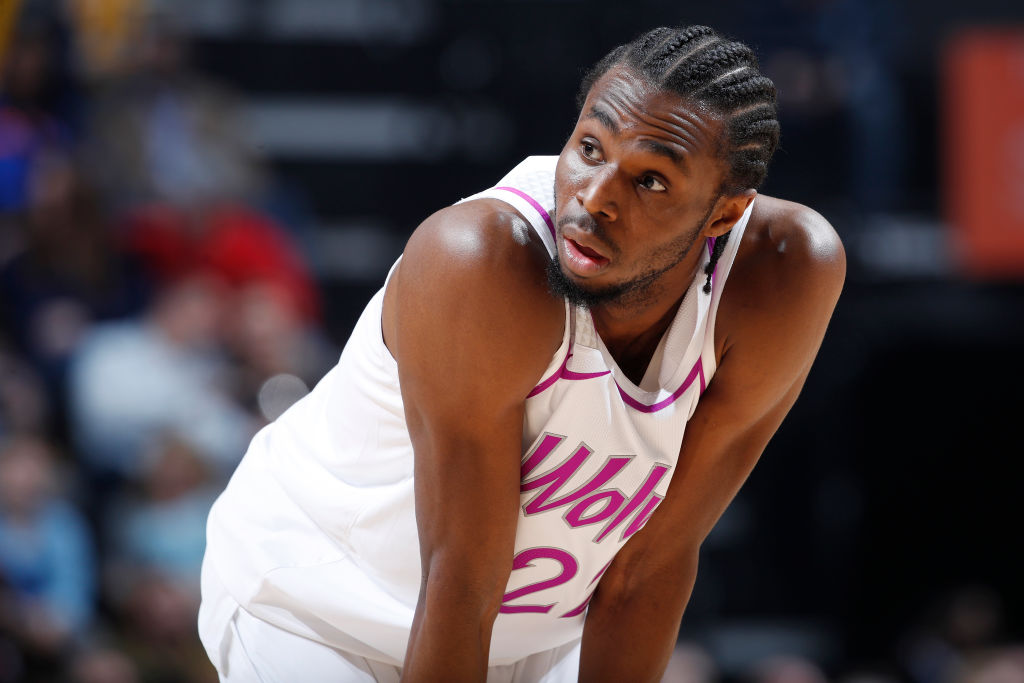
1. Andrew Wiggins
Small forward, Minnesota Timberwolves
- Wins Estimate Average: 0.2 (0, 0.6, 0)
- Expected Salary: $592,600
- Cap Figure: $25,467,250
- Difference: $24,874,650
Wiggins essentially played at a replacement level this season; his $592,600 expected salary is about $1 million lower than the minimum a player of his experience could have been paid. In fact, his VORP figure was -0.6, suggesting he actually cost his team about 1.6 wins relative to a replacement player. The really bad news: This was just the first year in a five-year extension, with his salary rising all the way to $33,616,770 for 2022-23.
-Brett Knight; Forbes Staff